Patagonia’s quality rating system is designed with ecological footprint in mind. Here’s why.
Our first sleeping bags, launched in 2017, were 45 years in the making. Made with virgin down certified to the Global Traceable Down Standard, and built to last a generation, we thought they were the epitome of quality and good design. Then one came back for a zipper repair and our repairs team realised there was no way to replace the zipper without losing some of the down fill. While the product was a complete success in terms of performance, it failed our repairability standard. We went back to the drawing board and changed the zipper design so it could be removed/repaired without breaching the baffles that house the down.
Patagonia started out making climbing gear, and has been in the business of making clothing and gear for 48 years. And while our commitment to quality has been unwavering—and evolving—we’ve witnessed seismic changes in the global apparel and textiles industry, largely driven by economies of scale—with average costs dropping as outputs increase.
 Val Franco, sewing manager, at work stitching a difficult curved leather strap on Chouinard Equipment’s Ultima Thule backpack in 1973. Photo: Gary Regester.
For instance, the price of clothing has dropped by more than half over the last 20 years. At the same time, the perceived value of clothing has also dropped, which has directly affected how long it’s kept in use. The average American will throw away 81 pounds of clothing this year alone. This contributes to the 26 billion pounds of textiles (clothing, rugs, footwear, leather goods, etc.) sent to landfills every year.
Disposable clothing and gear—along with electronics, packaging, etc.—are not built with quality in mind, so there’s a direct correlation between the quality of a product and how long people will hold onto it. And we think it’s our responsibility as a clothing and gear manufacturer to help offset the harm to the environment caused by a throwaway mentality.
Over the years, the word “quality” has nearly lost its meaning due to overuse, especially in marketing and advertising. At Patagonia, we made the word objective and measurable. A generation ago there were no books that told us how to make quality clothing. Which meant we had to invent—and agree on—how we define quality and assign the criteria to clothing.
Yvon Chouinard wrote about the direct link between quality products and environmental impact in the first edition of Let My People Go Surfing, which includes this quote from Gränsfors Bruk, a Swedish company that has been hand-forging axes for over 100 years:
“A high-quality product, in the hands of those who have learned how to use it and how to look after it, will very likely be more durable…increased durability means that we take less (decreased consumption of material and energy), that we need to produce less (gives us more time to do other things we think are important or enjoyable), and destroy less (less waste).”
If you consider the amount of raw material resources that go into the production of a new garment, as well as the environmental impacts (carbon emissions, water and energy usage, natural resource extraction), it makes sense to hold onto our clothing and gear as long as possible—or even longer by handing it down to the next generation. It’s not a new idea, it’s just one that’s been largely forgotten.
 The fish are safe – for the time being. Kimi Werner soaks in a hot tub in the sun, somewhere south of Japan. Photo: Tim Davis.
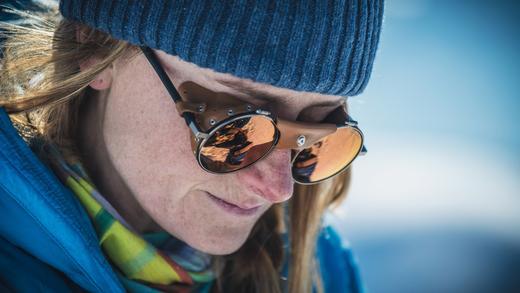
What does a bikini have to do?
Back when we were exclusively making climbing gear, quality was a primary consideration because climbers trusted our gear with their lives. But when we started sewing clothing we came across end-use considerations that went beyond hammering out a piton. We brought with us an industrial design and engineering focus. Which is why our first shorts were so stiff they stood up to granite, but also stood up on their own, and we were field-testing unproven materials, like polyester pile on rime-ice walls in Scotland and cotton rugby shirts on big walls in Yosemite.
We applied the same principles and questions asked in industrial design: is it useful, aesthetically pleasing, long-lasting? For example, if we design a bikini, we start with the same questions that we ask if we’re making an alpine climbing jacket. What does a bikini have to do? (Stay on.) But then how do we also make it durable, timeless, aesthetically pleasing?
The more we learned about making clothing the more we had to figure out. While we promoted an environmental ethos in our early climbing philosophy, it wasn’t until we got a closer look at our clothing supply chain that we realised “causing no unnecessary harm” also applied to how our clothing was made. We needed to build a scoring system to get everyone on the same page as the company grew, and it had to include further reducing the environmental impact of our clothing.
In 2005, we designed an informal check against outlined attributes of what “quality” means to us (based on our Design Philosophy). Our first, and more formalised product scorecard was implemented in 2015. It was akin to an algorithm, a set of rules that solve a stated problem. The desired outcome was not based on profitability; it was based on designing an objective measurement of quality. While the methodology has become more refined over the years (we recently added “repairable” to the scoring), the scorecard criteria hasn’t changed much since then.
We start with the ultimate score, a “10,” and deduct points when a product falls short in any of the categories. Here’s what a scorecard list looks like today:
1. Is it functional?
2. Is it multifunctional?
3. Is it durable?
4. Does it cause any unnecessary harm?
5. Is it repairable?
6. Does it have aesthetic appeal?
7. Does it fit?
8. Is it easy to care for?
9. Is it globally relevant?
10. Is the product and line simple?
Measuring the quality and environmental impact of each product is a multiteam effort. One stop along the way is within our 30-person Materials Innovation & Development (MID) department. Steph Karba, an environmental researcher on our Product Responsibility team, which operates within MID, is one of several employees who are tasked with measuring and managing the environmental impact of our products.
Karba looks at three key components to determine her area of scoring (#4: “no unnecessary harm”): the carbon intensity of a product, the percentage of “preferred materials” (e.g., organic cotton or recycled inputs) and the incorporation of environmental innovations. She uses computer modeling to come up with objective scoring.
“Up until a couple of years ago we did all of the scoring manually so we only had capacity to look at new and redesigned products,” says Karba. “Now with computer modeling, which includes more equations and analytics, we can assess 100 percent of the line, and with way more objectivity than the original product scoring system.”
Other members on the team look at things like the circular economy and recycling potential, and opportunities to use raw materials grown using Regenerative Organic practices that help sequester carbon in the soil. For the carbon intensity portion of the scoring, the Product Responsibility team relies on life-cycle assessments that they’ve commissioned from researchers, as well as tools from the Sustainable Apparel Coalition (SAC), the apparel industry’s leading alliance for sustainable production.
Brett Vanderblock, a data scientist on the team, weaves life-cycle analysis and raw material data together in a way that product designers, material developers and anyone involved in the scoring process can access. With the data visualisations and the guidance from the Product Responsibility team, product designers are able to see where impact is coming from and how to reduce it for the next season, ultimately getting each product closer to a “10.”
To date, the average Patagonia product score is 8.87, with the highest being 9.64—obtained by the Men’s Long-Sleeved Work Pocket T-Shirt—a simple design made from a blend of industrial hemp and organic cotton, and Fair Trade Certified™ sewn. The lowest-scoring product is 7.19. Lower-scoring products usually don’t hold a strong position in the “no unnecessary harm” category, are overly complicated and/or impossible to repair. Any products below an 8 on the scorecard are either dropped or pushed out to a new season until they can be improved.
“We’ve been focused on quality from the very beginning, and it’s not something we’re ever going to walk away from.”
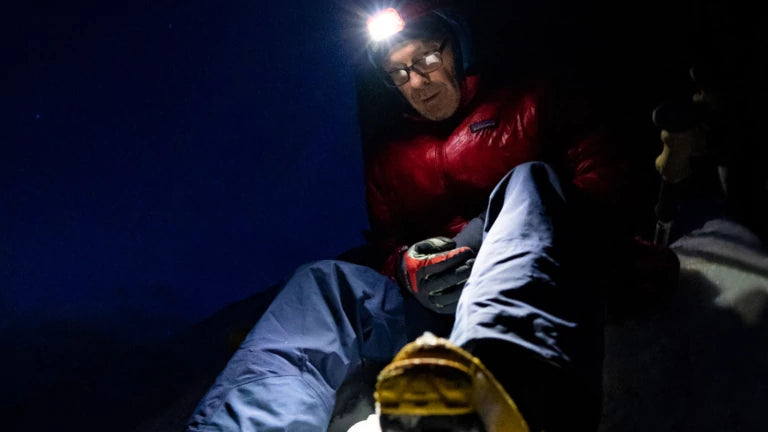
One thing that hasn’t changed since the origins of the company is testing quality in the field. Durability and function/multifunction correlate directly to how long a product will stay in use. While the field-testing program has grown in terms of scale and sophistication, the idea of getting a product in the hands of experienced alpinists, surfers and anglers to get feedback has remained the same since it was done by Yvon and his friends.
Walker Ferguson, who manages field-testing, has been working with a group of athletes around the world for about 10 years. And before him, it was his father, Duncan, who managed the program for 25 years.
“It’s kind of obvious that quality is an environmental issue,” says Ferguson. “We’ve been focused on quality from the very beginning, and it’s not something we’re ever going to walk away from.”
While there are parameters for testers, like a focus on comfort, durability and the like, Ferguson doesn’t limit what type of feedback comes in. That would defeat the purpose of discovering and capturing new, unexpected ideas and getting a more holistic view. Test results come back in longhand form and are collected and housed in a database that product designers can access. This is critical data that is impossible to gather any other way.
 Clare Gallagher and Luke Nelson take notes after testing prototypes of the High Endurance Kit, a trail running kit for long alpine missions, in the Dolomites. Photo: Eliza Earle.
Putting it all together
With so many score-related inputs, data and opinions coming in from design, research and testing—and all while a product is being developed—how is it all managed? That’s where Annika Washburn, our Quality Insights & Strategy manager, comes in. She manages the scoring process and captures inputs while constantly nudging the process forward.
Washburn also manages how scoring shifts and improvements are made. In 2016, it became clear that repairability needed to be added to the scoring system. Later, Yvon realised that some factors in the scoring needed to be weighted more heavily, like durability, functionality/multifunctionality and environmental impact. These three are now double-weighted because if any of their criteria aren’t met, there’s no point in making the product. For example, if a product is easy to care for but not functional, what’s its purpose? And if it causes unnecessary harm but is aesthetically pleasing, we’re not fulfilling our company mission to save our home planet.
Washburn also captures and manages customer feedback and data that comes back to the company after a product is released into “the wild”: ratings from our website, returns data, defective rates, plus information and trends from our repairs department in Reno, the largest outdoor gear repair facility in the country. All of this data is fed back to the score-makers and product developers so they can continually improve on their ideas, whether it’s a product already in use or an untested theory.
While the product scorecard has been in place for five years, probably the biggest indicator that it’s working to help improve quality is that scoring is now deeply embedded in the company thinking across multiple departments.
Now, no matter how psyched we are about a new product, someone’s inevitably going to ask the question, “Yeah, but is it a 10?”
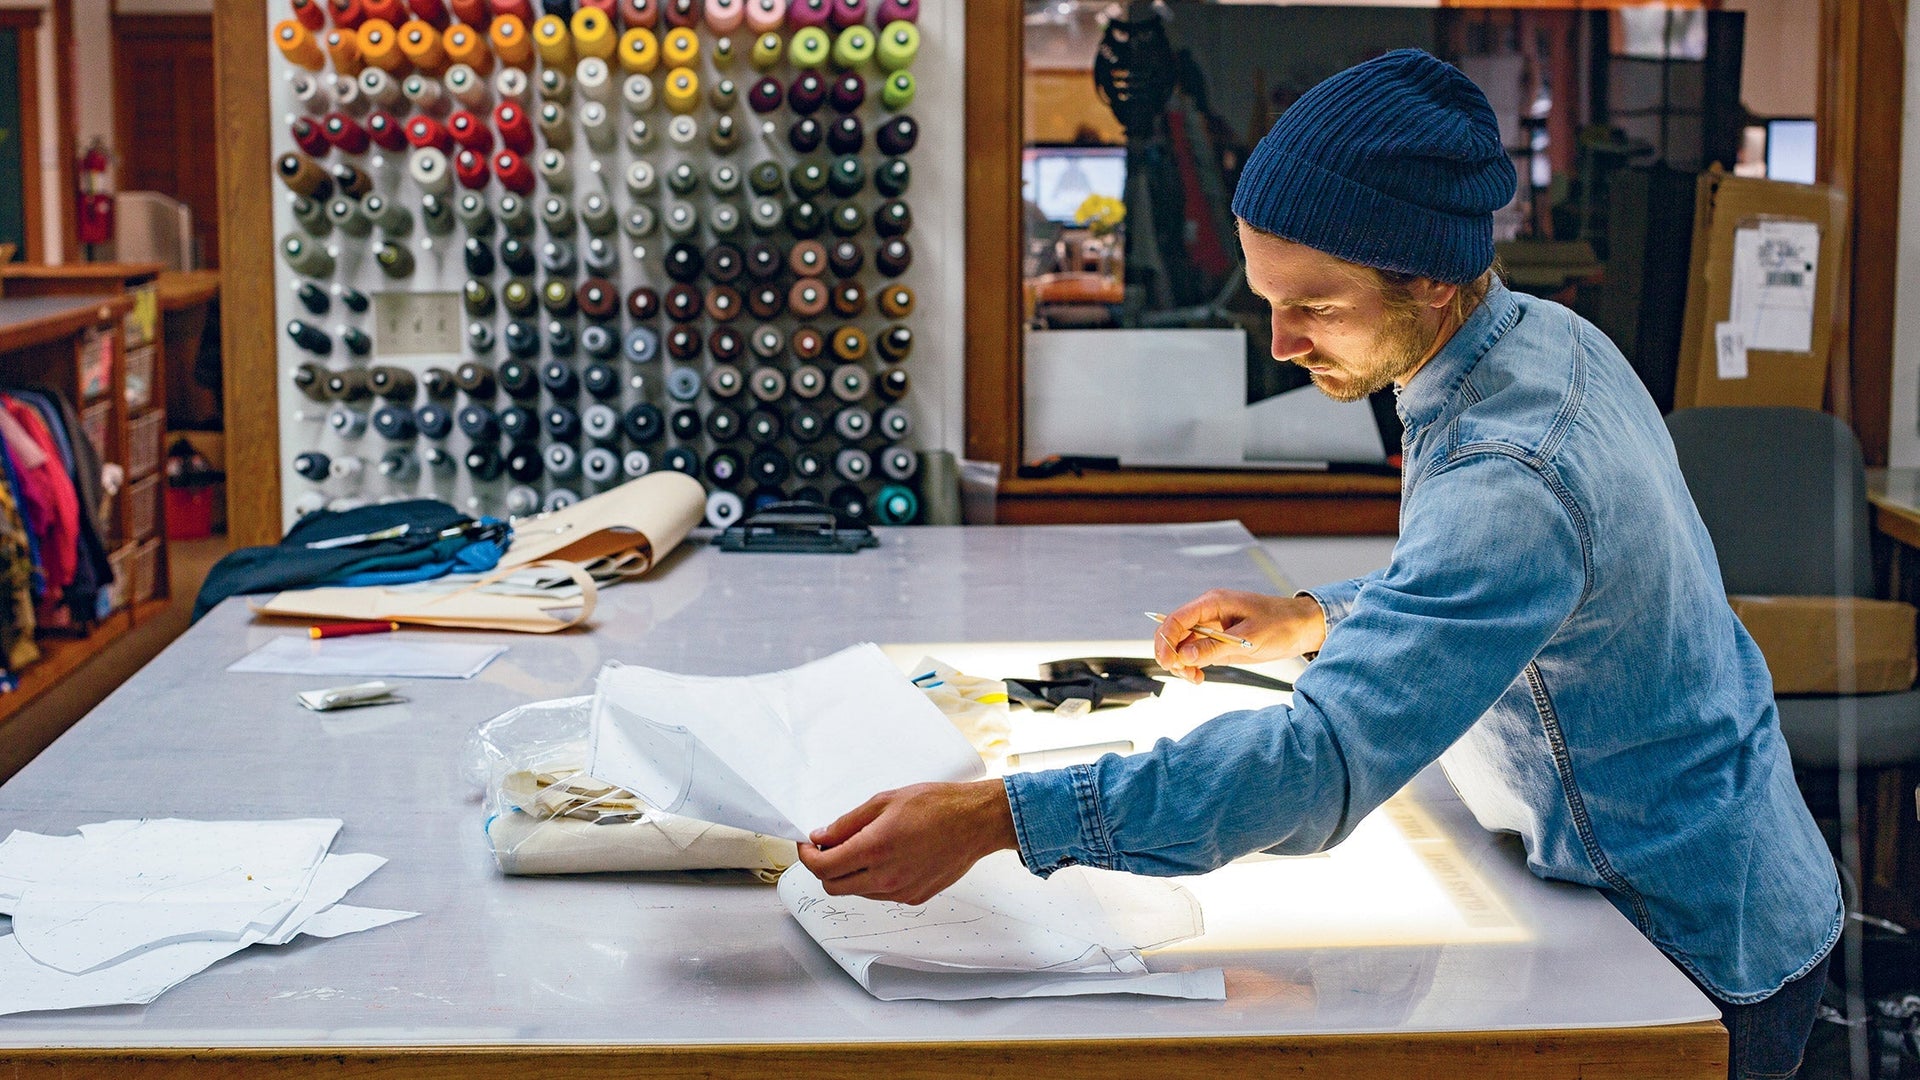
Banner image – Designer Eric Noll reviews patterns for trail running gear. Photo: Kyle Sparks.